
1/8
Auction
£200,000
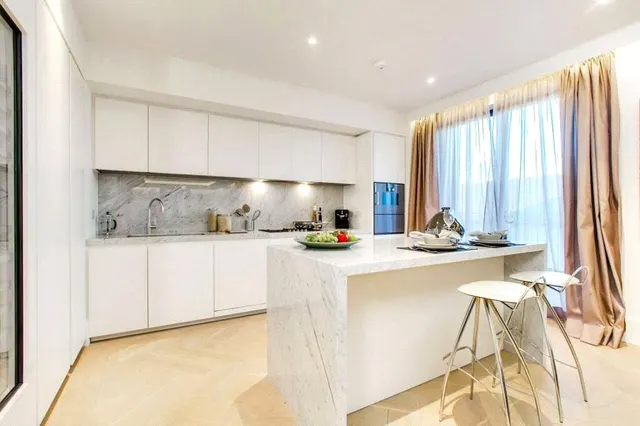
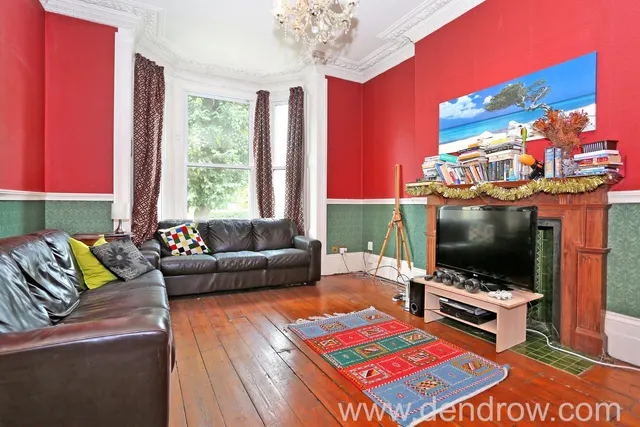
2 beds · 1 bath · 515 sq ft
Broadway, Rainham, RM13
Added on 31/08/2026 
66,993 sales registered so far in the 12 months to May 2026 · HM Land Registry data
The average (median) house price in London was £525,000 in the 12 months to May 2026, from 66,993 sales registered so far — 1.2% down on the year before and 4.0% up on five years ago. Flats homes were the most common sale at a median £425,000; detached £900,000; semi-detached £630,000; terraced £595,000. Homes with a recorded floor area sold for about £617 per square foot (£6,641/m²), based on 146,559 of 157,043 sales over two years.
Sales completed to July 2026, as registered by 29 Aug 2026 · headline figures cover the 12 months to May 2026 (later months are still being registered) London = the ONS region
| vs parent | |||||
|---|---|---|---|---|---|
| Wandsworth London | £650,000 | £790 | 0.0% | 3,967 | 124% |
| Bromley London | £520,000 | £538 | +1.0% | 3,437 | 99% |
| Croydon London | £425,000 | £465 | 0.0% | 3,273 | 81% |
| Havering London | £450,000 | £478 | +1.1% | 2,863 | 86% |
| Lambeth London | £535,000 | £699 | +0.9% | 2,800 | 102% |
| Lewisham London | £480,000 | £601 | 0.0% | 2,656 | 91% |
| Waltham Forest London | £548,680 | £652 | +4.5% | 2,565 | 105% |
| Southwark London | £550,000 | £732 | +1.9% | 2,536 | 105% |
| Richmond London | £701,750 | £744 | +1.7% | 2,456 | 134% |
| Barnet London | £585,000 | £600 | +2.6% | 2,424 | 111% |
| Hillingdon London | £505,000 | £544 | +1.0% | 2,268 | 96% |
| Greenwich London | £452,750 | £535 | −1.6% | 2,234 | 86% |
| Bexley London | £430,000 | £484 | +0.6% | 2,163 | 82% |
| Sutton London | £460,000 | £515 | −2.1% | 2,102 | 88% |
| Enfield London | £482,000 | £527 | +0.4% | 2,093 | 92% |
| Ealing London | £525,000 | £653 | −2.2% | 2,061 | 100% |
| Haringey London | £590,000 | £711 | +3.5% | 1,938 | 112% |
| Tower Hamlets London | £475,000 | £677 | −8.8% | 1,931 | 90% |
| Islington London | £658,400 | £903 | +2.1% | 1,926 | 125% |
| Merton London | £557,500 | £662 | −1.3% | 1,901 | 106% |
| Hounslow London | £495,000 | £582 | −1.0% | 1,845 | 94% |
| Redbridge London | £500,000 | £508 | +2.0% | 1,772 | 95% |
| Westminster London | £830,000 | £1,092 | −7.8% | 1,719 | 158% |
| Romford London | £430,000 | £465 | −0.6% | 1,659 | 82% |
| Hammersmith and Fulham London | £715,000 | £885 | −3.4% | 1,655 | 136% |
| Kingston upon Thames London | £543,750 | £616 | +1.6% | 1,556 | 104% |
| Harrow London | £562,000 | £548 | +2.2% | 1,507 | 107% |
| Camden London | £748,000 | £961 | −2.1% | 1,493 | 142% |
| Newham London | £431,000 | £528 | −2.2% | 1,435 | 82% |
| Hackney London | £578,575 | £804 | −1.1% | 1,400 | 110% |
| Brent London | £540,000 | £584 | −0.6% | 1,283 | 103% |
| Kensington and Chelsea London | £1,069,688 | £1,269 | −10.9% | 1,250 | 204% |
| Orpington London | £525,000 | £535 | +2.7% | 1,026 | 100% |
| Barking and Dagenham London | £385,000 | £454 | +4.1% | 961 | 73% |
| Ilford London | £505,000 | £476 | +1.0% | 847 | 96% |
| Hornchurch London | £490,000 | £499 | +5.4% | 810 | 93% |
| Uxbridge London | £515,000 | £539 | +5.1% | 784 | 98% |
| Twickenham London | £680,000 | £731 | +7.1% | 699 | 130% |
| Dagenham London | £385,000 | £465 | +4.1% | 698 | 73% |
| Beckenham London | £550,000 | £562 | +1.5% | 663 | 105% |
| Sidcup London | £435,000 | £508 | 0.0% | 596 | 83% |
| South Croydon London | £470,000 | £472 | +4.4% | 574 | 90% |
| Surbiton London | £525,000 | £624 | +1.9% | 568 | 100% |
| Bexleyheath London | £460,000 | £491 | +2.2% | 533 | 88% |
| Ruislip London | £557,500 | £593 | −3.0% | 476 | 106% |
| Wembley London | £508,500 | £551 | −3.1% | 454 | 97% |
| Hayes London | £461,250 | £554 | +3.2% | 450 | 88% |
| Feltham London | £435,000 | £510 | +2.4% | 411 | 83% |
| Wallington London | £407,500 | £481 | −2.7% | 368 | 78% |
| Welling London | £467,000 | £500 | +1.5% | 358 | 89% |
| Woodford Green London | £611,250 | £572 | +5.4% | 358 | 116% |
| Carshalton London | £450,000 | £539 | −1.5% | 350 | 86% |
| Pinner London | £700,000 | £597 | −0.5% | 346 | 133% |
| Coulsdon London | £571,000 | £481 | +2.2% | 341 | 109% |
| Edgware London | £550,000 | £528 | +4.8% | 341 | 105% |
| New Malden London | £647,500 | £618 | −2.1% | 340 | 123% |
| Mitcham London | £430,000 | £518 | −3.4% | 329 | 82% |
| Upminster London | £557,500 | £528 | −5.0% | 322 | 106% |
| Teddington London | £728,250 | £769 | −7.5% | 312 | 139% |
| Isleworth London | £485,000 | £564 | −4.0% | 301 | 92% |
| Barking London | £356,500 | £435 | +2.0% | 296 | 68% |
| Worcester Park London | £585,000 | £572 | +1.7% | 294 | 111% |
| Rainham London | £428,000 | £458 | +1.9% | 291 | 82% |
| Morden London | £495,000 | £584 | −2.0% | 280 | 94% |
| Purley London | £500,000 | £480 | −4.9% | 277 | 95% |
| Brentford London | £456,000 | £610 | −7.3% | 271 | 87% |
| Greenford London | £510,000 | £556 | 0.0% | 267 | 97% |
| Erith London | £365,000 | £406 | −1.4% | 266 | 70% |
| Hampton London | £665,000 | £644 | +6.8% | 263 | 127% |
| Stanmore London | £606,000 | £572 | +1.0% | 261 | 115% |
| Thornton Heath London | £420,000 | £439 | +5.0% | 258 | 80% |
| Southall London | £450,000 | £522 | −1.1% | 248 | 86% |
| Northolt London | £425,000 | £509 | +11.1% | 247 | 81% |
| Chislehurst London | £622,500 | £577 | +1.8% | 238 | 119% |
| Westerham London | £475,000 | £445 | +1.6% | 232 | 90% |
| Chessington London | £470,000 | £540 | −1.3% | 227 | 90% |
| West Wickham London | £670,000 | £525 | +1.5% | 199 | 128% |
| West Drayton London | £410,000 | £513 | −3.6% | 196 | 78% |
| Northwood London | £725,500 | £570 | −1.0% | 178 | 138% |
| City of London London | £740,000 | £995 | −5.1% | 170 | 141% |
| Belvedere London | £365,000 | £436 | 0.0% | 168 | 70% |
| Kenley London | £475,000 | £456 | −4.0% | 103 | 90% |
| Type | Sales | Median price | £/sq ft | Typical size | Change (1y) |
|---|---|---|---|---|---|
| Detached | 3,324 | £900,000 | £588 | 1,561 sq ft | 0.0% |
| Semi-detached | 10,903 | £630,000 | £567 | 1,141 sq ft | +1.6% |
| Terraced | 19,660 | £595,000 | £607 | 1,023 sq ft | +0.8% |
| Flats | 33,106 | £425,000 | £640 | 678 sq ft | −5.6% |
| Period | Median sold price | Sales |
|---|---|---|
| Q4 2021 | £498,000 | 19167 |
| Q1 2022 | £515,000 | 21723 |
| Q2 2022 | £520,000 | 23277 |
| Q3 2022 | £543,450 | 28005 |
| Q4 2022 | £525,000 | 26187 |
| Q1 2023 | £515,000 | 19113 |
| Q2 2023 | £525,000 | 16377 |
| Q3 2023 | £545,000 | 21628 |
| Q4 2023 | £525,000 | 18952 |
| Q1 2024 | £519,975 | 17152 |
| Q2 2024 | £530,675 | 19278 |
| Q3 2024 | £550,000 | 23824 |
| Q4 2024 | £530,000 | 23020 |
| Q1 2025 | £525,000 | 29399 |
| Q2 2025 | £538,888 | 13079 |
| Q3 2025 | £550,000 | 21339 |
| Q4 2025 | £520,000 | 18557 |
| Q1 2026 | £510,000 | 13972 |
| Q2 2026 | £500,000 | 11077 |
| Q3 2026 | £516,000 | 2023 |
Median of completed sales per period, not seasonally adjusted; the latest months are still being registered.
UK House Price Index (mix-adjusted) for London: £553,870, −2.5% on the year (June 2026) — why this differs from our median.
Most homes in London sold for £240k–£765k (76% of sales).
| Sold | Address | Type | Price | Floor area | £/sq ft | vs last sale |
|---|---|---|---|---|---|---|
| 31 Jul 2026 | Ground and First Floor Maisonette, 16, Armadale Road SW6 1JP | Flats · Leasehold | £865,000 | 861 sq ft | £1,005 | — |
| 31 Jul 2026 | 186, Barcombe Avenue SW2 3BD | Terraced | £821,500 | 1,378 sq ft | £596 | — |
| 31 Jul 2026 | 23, Carlton Road RM2 5AP | Semi-detached | £570,000 | 1,367 sq ft | £417 | — |
| 30 Jul 2026 | Flat 28, Cumberland Mansions, West End Lane NW6 1LL | Flats · Leasehold | £870,000 | 969 sq ft | £898 | — |
| 30 Jul 2026 | 10, Violet Road E18 1DG | Terraced | £801,000 | 1,141 sq ft | £702 | — |
| 30 Jul 2026 | 48, Elm Road KT3 3HD | Terraced | £755,000 | 1,324 sq ft | £570 | — |
| 30 Jul 2026 | 61, Warley Avenue UB4 0RA | Terraced | £521,000 | 1,195 sq ft | £436 | — |
| 30 Jul 2026 | 34, Strawberry Lane SM5 2NQ | Flats · Leasehold | £365,000 | 667 sq ft | £547 | — |
| 30 Jul 2026 | Flat 9, Challenge Court, Langhorn Drive TW2 7SY | Flats · Leasehold | £315,000 | 624 sq ft | £505 | −13% (2024) |
| 29 Jul 2026 | 14, Pitfold Road SE12 9HX | Semi-detached | £825,000 | 1,582 sq ft | £521 | — |
| 29 Jul 2026 | Flat 16, Somerville House, Manor Fields SW15 3LX | Flats · Leasehold | £785,000 | 1,076 sq ft | £729 | +0% (2023) |
| 29 Jul 2026 | 34, Cross Street TW12 1RT | Semi-detached | £782,500 | 990 sq ft | £790 | — |
| 29 Jul 2026 | 114, Carnarvon Avenue EN1 3DS | Semi-detached | £740,000 | 1,528 sq ft | £484 | — |
| 29 Jul 2026 | Flat 34, Cochrane Close 27-37, Cochrane Street NW8 7NS | Flats · Leasehold | £735,000 | 829 sq ft | £887 | — |
| 29 Jul 2026 | 354, St Davids Square E14 3WG | Flats · Leasehold | £628,000 | 1,206 sq ft | £521 | — |
| 29 Jul 2026 | Flat 28, Cochrane Close 27-37, Cochrane Street NW8 7NS | Flats · Leasehold | £600,000 | 721 sq ft | £832 | — |
| 29 Jul 2026 | 3, Ascot Road N15 5RA | Terraced | £540,000 | 753 sq ft | £717 | — |
| 29 Jul 2026 | 9b, Sharpleshall Street NW1 8YN | Flats · Leasehold | £465,000 | 291 sq ft | £1,600 | — |
| 29 Jul 2026 | 27a, Hazelmere Road NW6 7HA | Flats · Leasehold | £460,000 | 495 sq ft | £929 | — |
| 29 Jul 2026 | Flat 4, 17, South Hill Park NW3 2ST | Flats · Leasehold | £430,000 | 441 sq ft | £974 | — |
| 29 Jul 2026 | 4, Newbery Road DA8 2BY | Semi-detached | £430,000 | 1,044 sq ft | £412 | — |
| 29 Jul 2026 | 2, Fuller Road RM8 2TT | Semi-detached | £425,000 | 915 sq ft | £465 | — |
| 29 Jul 2026 | 11, Lovat Close NW2 7RU | Terraced · Leasehold | £360,000 | 624 sq ft | £577 | — |
| 29 Jul 2026 | Flat 8, Katherine Court, 39, Stodart Road SE20 8ET | Flats · Leasehold | £350,000 | 614 sq ft | £570 | −2% (2024) |
| 29 Jul 2026 | Flat 805, Dryden Building, 37, Commercial Road E1 1LF | Flats · Leasehold | £336,000 | 732 sq ft | £459 | — |
Medians over five years for streets with at least five sales; "most active" counts the last 12 months.
Homes for sale in London today ask a median £525,000 (n = 6,190) vs £525,000 sold — asking is 0% above recent sold prices; £559 vs £617 per sq ft. 6% of Homello's listings here are under offer. Asking ≠ achieved; sold prices reflect deals agreed 4–6 months ago.




New-build sales register 6–12 months after completion; "resale" means a later sale at an address whose first recorded sale was a new build.
Part of England
A 90 m² (970 sq ft) home in London is worth roughly £485k–£767k at the area's typical £501–£792 per square foot — a range, not a valuation.
Check your addressThe median sold price in London was £525,000 in the 12 months to May 2026 (66,993 sales registered so far); the mean was £687,336. We quote medians because a few very expensive or very cheap sales pull a mean around. The England median over the same period was £297,500. Portals and the ONS publish different figures because they use different boundaries, windows and adjustments.
Homes sold in London over the two years to May 2026 with a recorded floor area achieved a median £617 per square foot (interquartile range £501–£792), from 146,559 sales matched to an Energy Performance Certificate floor area.
In the 12 months to May 2026, the median was 1.2% down on the previous 12 months and 4.0% up on five years earlier. These compare completed sales registered so far; the most recent months are still being registered, so the latest figures move as late registrations arrive.
Of streets with at least five sales in the last five years, Grosvenor Place (SW1X) has the highest median sold price at £26,800,500 across 11 sales.
Every sale is from HM Land Registry's Price Paid Data for England and Wales, which we re-import monthly. Sales completed to July 2026, as registered by 29 Aug 2026 · headline figures cover the 12 months to May 2026 (later months are still being registered). Floor areas come from Energy Performance Certificates matched by address.
One email a month with the sales newly registered here — no account needed, unsubscribe in one click.
Sources and method. Sales completed to July 2026, as registered by 29 Aug 2026 · headline figures cover the 12 months to May 2026 (later months are still being registered).Next HM Land Registry release ~28 Sept 2026. Medians unless stated; averages only where 30 or more sales. Category A sales only (standard price-paid transactions), houses and flats.
Contains HM Land Registry data © Crown copyright and database right 2021. This data is licensed under the Open Government Licence v3.0. Floor areas derived from Energy Performance Certificate data © Crown copyright, licensed under the Open Government Licence v3.0. Contains OS data © Crown copyright and database right 2026. Contains Royal Mail data © Royal Mail copyright and database right 2026. Source: Office for National Statistics licensed under the Open Government Licence v3.0.
How we calculate these figures · Ask us to hide a sale or correct a record
