
1/17
£425,000
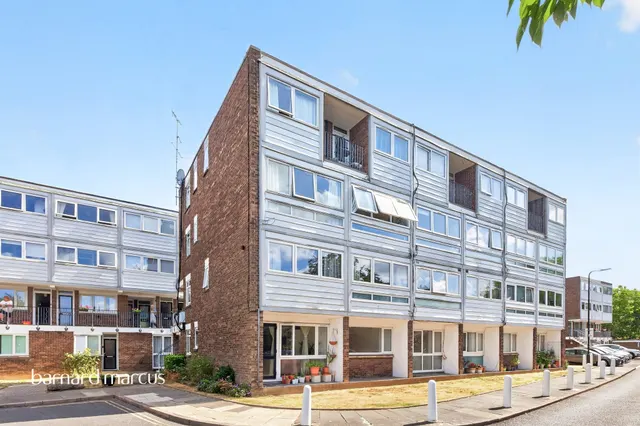
Flat · 2 beds · 1 bath · 748 sq ft
Ealing Road, Brentford, TW8
Leasehold
Added on 21/09/2026 
London · 2,046 sales registered so far in the 12 months to June 2026 · HM Land Registry data
The average (median) house price in Ealing, London was £525,000 in the 12 months to June 2026, from 2,046 sales registered so far. That is 1.9% down on the year before and 3.1% up on five years ago. Flats homes were the most common sale at a median £399,975; detached £1,612,500; semi-detached £760,000; terraced £675,000. Homes with a recorded floor area sold for about £657 per square foot (£7,072/m²), based on 4,742 of 4,939 sales over two years.
Sales completed to August 2026, as registered by 4 Oct 2026 · headline figures cover the 12 months to June 2026 (later months are still being registered) Ealing = the London Borough of Ealing, by the ONS boundary
| Type | Sales | Median price | £/sq ft | Typical size | Change (1y) |
|---|---|---|---|---|---|
| Detached | 66 | £1,612,500 | £759 | 1,943 sq ft | +24.0% |
| Semi-detached | 343 | £760,000 | £652 | 1,173 sq ft | −0.7% |
| Terraced | 633 | £675,000 | £655 | 1,055 sq ft | −1.0% |
| Flats | 1,004 | £399,975 | £629 | 635 sq ft | −5.9% |
| Period | Median sold price | Sales |
|---|---|---|
| Q4 2021 | £495,000 | 647 |
| Q1 2022 | £519,820 | 799 |
| Q2 2022 | £522,500 | 780 |
| Q3 2022 | £530,000 | 871 |
| Q4 2022 | £525,000 | 921 |
| Q1 2023 | £490,000 | 657 |
| Q2 2023 | £530,000 | 525 |
| Q3 2023 | £544,500 | 699 |
| Q4 2023 | £520,000 | 607 |
| Q1 2024 | £500,000 | 580 |
| Q2 2024 | £500,000 | 656 |
| Q3 2024 | £550,000 | 777 |
| Q4 2024 | £544,175 | 784 |
| Q1 2025 | £525,000 | 885 |
| Q2 2025 | £530,000 | 447 |
| Q3 2025 | £532,000 | 645 |
| Q4 2025 | £530,000 | 573 |
| Q1 2026 | £520,000 | 489 |
| Q2 2026 | £510,000 | 339 |
| Q3 2026 | £540,000 | 159 |
Median of completed sales per period, not seasonally adjusted; the latest months are still being registered.
UK House Price Index (mix-adjusted) for Ealing: £589,875, +1.8% on the year (August 2026). Why this differs from our median.
Most homes in Ealing sold for £235k–£685k (69% of sales).
| Sold | Address | Type | Price | Floor area | £/sq ft | vs last sale |
|---|---|---|---|---|---|---|
| 21 Aug 2026 | 44, St Marks Road W7 2PW | Semi-detached | £950,000 | 1,302 sq ft | £729 | n/a |
| 20 Aug 2026 | 114, Acton Lane W4 5HH | Terraced · Leasehold | £500,000 | 624 sq ft | £801 | −4% (2020) |
| 18 Aug 2026 | 39, St Kilda Road W13 9DF | Terraced | £860,000 | 1,152 sq ft | £747 | n/a |
| 18 Aug 2026 | 40, North Road UB1 2JH | Terraced | £460,000 | 1,033 sq ft | £445 | n/a |
| 17 Aug 2026 | Flat 17, Levett House, Holman Drive UB2 4FT | Flats · Leasehold | £372,500 | 764 sq ft | £487 | n/a |
| 17 Aug 2026 | 17a, Goring Way UB6 9NN | Flats · Leasehold | £330,000 | 506 sq ft | £652 | n/a |
| 14 Aug 2026 | Flat 2, 29, Birkbeck Grove W3 7QD | Flats · Leasehold | £550,000 | 1,012 sq ft | £544 | +7% (2019) |
| 14 Aug 2026 | 11, Primrose Way HA0 1DS | Semi-detached | £525,000 | 753 sq ft | £697 | n/a |
| 14 Aug 2026 | 104, Millet Road UB6 9SJ | Terraced | £470,000 | 958 sq ft | £491 | n/a |
| 12 Aug 2026 | Flat 26, Arlington Park Mansions, Sutton Lane North W4 4HE | Flats · Leasehold | £430,000 | 549 sq ft | £783 | n/a |
| 12 Aug 2026 | 131, Lady Margaret Road UB1 2PS | Terraced | £400,000 | n/a | n/a | n/a |
| 11 Aug 2026 | 80, Park View W3 0PT | Terraced | £775,000 | 1,399 sq ft | £554 | n/a |
| 10 Aug 2026 | 12, Laurel Gardens W7 3JG | Terraced | £660,000 | 1,119 sq ft | £590 | n/a |
| 10 Aug 2026 | 386, Whitton Avenue East UB6 0JS | Terraced | £525,000 | 936 sq ft | £561 | n/a |
| 10 Aug 2026 | 13, Alexandra House, Oldham Terrace W3 6NH | Flats · Leasehold | £320,000 | 452 sq ft | £708 | n/a |
| 7 Aug 2026 | 37, Bellevue Road W13 8DF | Terraced | £925,000 | 1,442 sq ft | £641 | n/a |
| 7 Aug 2026 | 60, Petts Hill UB5 4NN | Semi-detached | £633,000 | 1,292 sq ft | £490 | n/a |
| 7 Aug 2026 | First Floor Flat, 1, Winchester Street W3 8PA | Flats · Leasehold | £572,000 | 980 sq ft | £584 | n/a |
| 7 Aug 2026 | 3a, St Kilda Road W13 9DF | Flats · Leasehold | £518,000 | 700 sq ft | £740 | +8% (2021) |
| 7 Aug 2026 | Flat 13, Sandgate House, Queens Walk W5 1TN | Flats · Leasehold | £480,000 | 689 sq ft | £697 | +9% (2021) |
| 7 Aug 2026 | 80a, Boston Road W7 2ES | Flats · Leasehold | £450,000 | 721 sq ft | £624 | n/a |
| 7 Aug 2026 | 20, Lapponum Walk UB4 9PN | Semi-detached | £418,000 | 818 sq ft | £511 | n/a |
| 6 Aug 2026 | Flat 51, Edmonscote, Argyle Road W13 0HQ | Flats · Leasehold | £425,000 | 904 sq ft | £470 | n/a |
| 5 Aug 2026 | 37a, Petersfield Road W3 8NY | Flats · Leasehold | £540,000 | 764 sq ft | £707 | −2% (2019) |
| 5 Aug 2026 | 19, Alacia Court, Palmerston Road W3 8GJ | Flats · Leasehold | £475,000 | 807 sq ft | £588 | −8% (2021) |
The most recent registered sales. Full histories, including every sale since 1995, are on the street pages.
Medians over five years for streets with at least five sales; "most active" counts the last 12 months.
| District | Sales (12m) | Median | £/sq ft | Change (1y) |
|---|---|---|---|---|
| W5 | 370 | £622,500 | £745 | −4.2% |
| W3 | 361 | £490,000 | £676 | −2.6% |
| W13 | 313 | £760,000 | £723 | +4.8% |
| UB6 | 251 | £500,000 | £561 | −1.4% |
| W7 | 208 | £578,000 | £658 | +8.0% |
| UB5 | 141 | £438,000 | £506 | +3.8% |
| W4 | 119 | £572,000 | £876 | −18.1% |
| UB1 | 79 | £500,000 | £500 | +2.0% |
| UB2 | 56 | £377,500 | £479 | −3.2% |
| HA0 | 37 | £450,000 | £597 | −14.7% |
| NW10 | 35 | £410,000 | £562 | +2.5% |
| UB4 | 22 | £500,000 | £595 | n/a |
| HA4 | 19 | £388,000 | £574 | n/a |
| TW8 | 19 | £750,000 | £595 | n/a |
| W12 | 12 | £571,250 | £763 | n/a |
Homes for sale in Ealing today ask a median £500,000 (n = 1,867) vs £525,000 sold, so asking is 5% below recent sold prices; £628 vs £657 per sq ft. 34% of Homello's listings here are under offer. Asking ≠ achieved; sold prices reflect deals agreed 4–6 months ago.





New-build sales register 6–12 months after completion; "resale" means a later sale at an address whose first recorded sale was a new build.
Part of London
A 90 m² (970 sq ft) home in Ealing is worth roughly £540k–£750k at the area's typical £557–£774 per square foot. That is a range, not a valuation.
Check your addressThe median sold price in Ealing, London was £525,000 in the 12 months to June 2026 (2,046 sales registered so far); the mean was £633,564. We quote medians because a few very expensive or very cheap sales pull a mean around. The London median over the same period was £525,000. Portals and the ONS publish different figures because they use different boundaries, windows and adjustments.
Homes sold in Ealing, London over the two years to June 2026 with a recorded floor area achieved a median £657 per square foot (interquartile range £557–£774), from 4,742 sales matched to an Energy Performance Certificate floor area.
In the 12 months to June 2026, the median was 1.9% down on the previous 12 months and 3.1% up on five years earlier. These compare completed sales registered so far; the most recent months are still being registered, so the latest figures move as late registrations arrive.
Of streets with at least five sales in the last five years, Edgehill Road (W13) has the highest median sold price at £2,646,107 across 5 sales.
Every sale is from HM Land Registry's Price Paid Data for England and Wales, which we re-import monthly. Sales completed to August 2026, as registered by 4 Oct 2026 · headline figures cover the 12 months to June 2026 (later months are still being registered). Floor areas come from Energy Performance Certificates matched by address.
One email a month with the sales newly registered here. No account needed, and you can unsubscribe in one click.
Sources and method. Sales completed to August 2026, as registered by 4 Oct 2026 · headline figures cover the 12 months to June 2026 (later months are still being registered).Next HM Land Registry release ~28 Oct 2026. Medians unless stated; averages only where 30 or more sales. Category A sales only (standard price-paid transactions), houses and flats.
Contains HM Land Registry data © Crown copyright and database right 2021. This data is licensed under the Open Government Licence v3.0. Floor areas derived from Energy Performance Certificate data © Crown copyright, licensed under the Open Government Licence v3.0. Contains OS data © Crown copyright and database right 2026. Contains Royal Mail data © Royal Mail copyright and database right 2026. Source: Office for National Statistics licensed under the Open Government Licence v3.0.
How we calculate these figures · Ask us to hide a sale or correct a record


