
1/8
£440,000
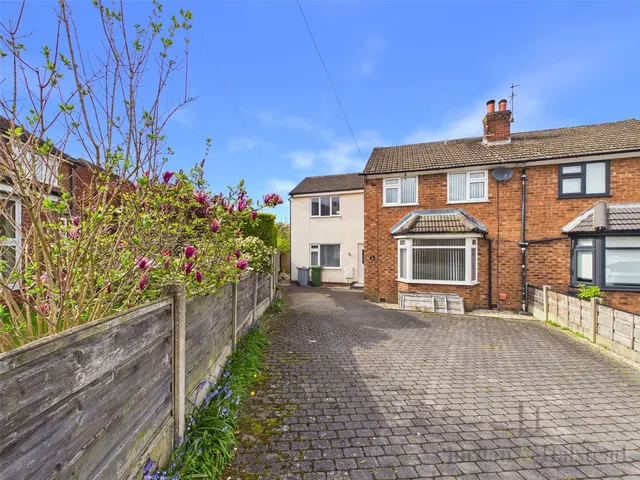
2 beds · 1 bath · 974 sq ft
Chorley Hall Lane, Alderley Edge, Cheshire, SK9
Leasehold
Added on 31/08/2026 
Cheshire · 112 sales registered so far in the 12 months to May 2026 · HM Land Registry data
The average (median) house price in Alderley Edge, Cheshire was £550,000 in the 12 months to May 2026, from 112 sales registered so far — 1.9% up on the year before and 6.8% up on five years ago. Semi-detached homes were the most common sale at a median £550,000; detached £972,500; terraced £460,000; flats £297,000. Homes with a recorded floor area sold for about £432 per square foot (£4,650/m²), based on 186 of 231 sales over two years.
Sales completed to July 2026, as registered by 29 Aug 2026 · headline figures cover the 12 months to May 2026 (later months are still being registered) Alderley Edge = the Alderley Edge post town: SK9 (as recorded in the sales)
| Type | Sales | Median price | £/sq ft | Typical size | Change (1y) |
|---|---|---|---|---|---|
| Detached | 30 | £972,500 | £475 | 1,733 sq ft | −0.3% |
| Semi-detached | 36 | £550,000 | £471 | 1,163 sq ft | — |
| Terraced | 21 | £460,000 | £440 | 980 sq ft | n < 30 |
| Flats | 25 | £297,000 | £367 | 861 sq ft | n < 30 |
| Period | Median sold price | Sales |
|---|---|---|
| Q4 2021 | £440,000 | 31 |
| Q1 2022 | £567,500 | 22 |
| Q2 2022 | £582,500 | 36 |
| Q3 2022 | £455,000 | 32 |
| Q4 2022 | £675,000 | 31 |
| Q1 2023 | £450,000 | 17 |
| Q2 2023 | £732,500 | 20 |
| Q3 2023 | £502,500 | 36 |
| Q4 2023 | £526,750 | 30 |
| Q1 2024 | £717,500 | 28 |
| Q2 2024 | £550,000 | 23 |
| Q3 2024 | £634,000 | 32 |
| Q4 2024 | £552,750 | 30 |
| Q1 2025 | £523,750 | 36 |
| Q2 2025 | £595,000 | 33 |
| Q3 2025 | £508,750 | 28 |
| Q4 2025 | £550,000 | 31 |
| Q1 2026 | £525,000 | 22 |
| Q2 2026 | £530,000 | 13 |
| Q3 2026 | £512,000 | 5 |
Median of completed sales per period, not seasonally adjusted; the latest months are still being registered.
Most homes in Alderley Edge sold for £145k–£820k (75% of sales).
| Sold | Address | Type | Price | Floor area | £/sq ft | vs last sale |
|---|---|---|---|---|---|---|
| 24 Jul 2026 | 93, Moss Lane SK9 7HP | Semi-detached · Leasehold | £512,000 | 1,163 sq ft | £440 | — |
| 17 Jul 2026 | 48, Moss Lane SK9 7HN | Semi-detached · Leasehold | £475,000 | 786 sq ft | £605 | +1% (2021) |
| 10 Jul 2026 | 8, Duke Street SK9 7HX | Terraced | £537,500 | 1,259 sq ft | £427 | +82% (2020) |
| 3 Jul 2026 | 1, Haddon Close SK9 7RD | Detached | £865,000 | 1,905 sq ft | £454 | — |
| 1 Jul 2026 | 3, Byron Place, 34, Heyes Lane SK9 7JY | Flats · Leasehold | £475,000 | 1,001 sq ft | £475 | +30% (2022) |
| 19 Jun 2026 | 92, Knutsford Road SK9 7SW | Terraced | £362,500 | 915 sq ft | £396 | +42% (2021) |
| 12 Jun 2026 | Flat 7, Brook View, Brook Lane SK9 7QG | Flats · Leasehold | £155,000 | 592 sq ft | £262 | — |
| 8 Jun 2026 | 69, Heyes Lane SK9 7LL | Semi-detached | £785,000 | 1,604 sq ft | £489 | +59% (2020) |
| 29 May 2026 | 31, Brook Lane SK9 7RU | Terraced · Leasehold | £439,950 | 786 sq ft | £560 | +16% (2022) |
| 28 May 2026 | 17, Grasmere Road SK9 7US | Detached | £650,000 | 1,033 sq ft | £629 | — |
| 27 May 2026 | 74, Heyes Lane SK9 7LE | Semi-detached | £875,000 | 1,496 sq ft | £585 | — |
| 26 May 2026 | Flat 22, Brook View, Brook Lane SK9 7QG | Flats · Leasehold | £145,000 | 667 sq ft | £217 | — |
| 22 May 2026 | 2, Meadscroft Drive SK9 7RJ | Detached | £1,580,000 | 3,305 sq ft | £478 | +32% (2019) |
| 20 May 2026 | 2, Grasmere Road SK9 7US | Detached | £700,000 | 1,475 sq ft | £475 | — |
| 19 May 2026 | 1, Hurst Lea Court SK9 7QF | Flats · Leasehold | £395,000 | 1,066 sq ft | £371 | +18% (2022) |
| 8 May 2026 | 6, Beech Cottages, Lydiat Lane SK9 7HB | Terraced | £530,000 | 1,206 sq ft | £440 | — |
| 8 May 2026 | 3, Elm Crescent SK9 7PQ | Semi-detached | £290,000 | 883 sq ft | £329 | — |
| 10 Apr 2026 | Rockwell House, Woodbrook Road SK9 7DB | Detached · Leasehold | £935,000 | — | — | — |
| 30 Mar 2026 | 9, South Bank Close SK9 7LQ | Terraced | £485,000 | 1,098 sq ft | £442 | — |
| 30 Mar 2026 | 2, Gail Close SK9 7PG | Semi-detached | £370,000 | 721 sq ft | £513 | +32% (2021) |
| 27 Mar 2026 | 22, Heyes Lane SK9 7JY | Semi-detached | £1,000,000 | 1,787 sq ft | £560 | — |
| 13 Mar 2026 | 3, Congleton Close SK9 7AJ | Detached | £1,260,000 | 3,488 sq ft | £361 | — |
| 12 Mar 2026 | Tall Trees, Chelford Road SK9 7TL | Detached | £2,200,000 | — | — | — |
| 12 Mar 2026 | 22, Downesway SK9 7XB | Detached · Leasehold | £775,000 | 1,733 sq ft | £447 | — |
| 27 Feb 2026 | Flat 1, Hillfield, 4, Congleton Road SK9 7AA | Flats · Leasehold | £424,000 | 1,087 sq ft | £390 | +19% (2024) |
The most recent registered sales. Full histories, including every sale since 1995, are on the street pages.
Medians over five years for streets with at least five sales; "most active" counts the last 12 months.
| District | Sales (12m) | Median | £/sq ft | Change (1y) |
|---|---|---|---|---|
| SK9 | 112 | £550,000 | £432 | +1.9% |


Part of Cheshire
A 90 m² (970 sq ft) home in Alderley Edge is worth roughly £356k–£484k at the area's typical £367–£499 per square foot — a range, not a valuation.
Check your addressThe median sold price in Alderley Edge, Cheshire was £550,000 in the 12 months to May 2026 (112 sales registered so far); the mean was £728,028. We quote medians because a few very expensive or very cheap sales pull a mean around. The Cheshire median over the same period was £270,000. Portals and the ONS publish different figures because they use different boundaries, windows and adjustments.
Homes sold in Alderley Edge, Cheshire over the two years to May 2026 with a recorded floor area achieved a median £432 per square foot (interquartile range £367–£499), from 186 sales matched to an Energy Performance Certificate floor area.
In the 12 months to May 2026, the median was 1.9% up on the previous 12 months and 6.8% up on five years earlier. These compare completed sales registered so far; the most recent months are still being registered, so the latest figures move as late registrations arrive.
Of streets with at least five sales in the last five years, Macclesfield Road (SK9) has the highest median sold price at £2,200,000 across 10 sales.
Every sale is from HM Land Registry's Price Paid Data for England and Wales, which we re-import monthly. Sales completed to July 2026, as registered by 29 Aug 2026 · headline figures cover the 12 months to May 2026 (later months are still being registered). Floor areas come from Energy Performance Certificates matched by address.
One email a month with the sales newly registered here — no account needed, unsubscribe in one click.
Sources and method. Sales completed to July 2026, as registered by 29 Aug 2026 · headline figures cover the 12 months to May 2026 (later months are still being registered).Next HM Land Registry release ~28 Sept 2026. Medians unless stated; averages only where 30 or more sales. Category A sales only (standard price-paid transactions), houses and flats.
Contains HM Land Registry data © Crown copyright and database right 2021. This data is licensed under the Open Government Licence v3.0. Floor areas derived from Energy Performance Certificate data © Crown copyright, licensed under the Open Government Licence v3.0. Contains OS data © Crown copyright and database right 2026. Contains Royal Mail data © Royal Mail copyright and database right 2026. Source: Office for National Statistics licensed under the Open Government Licence v3.0.
How we calculate these figures · Ask us to hide a sale or correct a record

