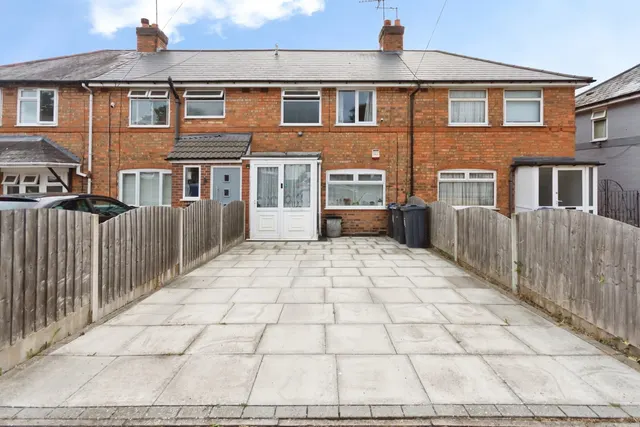
1/8
£135,000
2 beds · 1 bath · 441 sq ft
Wheatsheaf Road, Birmingham, West Midlands, B16 0RY
Leasehold
Added on 31/08/2026 
Birmingham · 175 sales registered so far in the 12 months to May 2026 · HM Land Registry data
The average (median) house price in Harborne, Birmingham was £375,000 in the 12 months to May 2026, from 175 sales registered so far — 13.6% up on the year before and 6.4% up on five years ago. Terraced homes were the most common sale at a median £355,000; detached £650,000; semi-detached £525,500; flats £142,000. Homes with a recorded floor area sold for about £362 per square foot (£3,897/m²), based on 369 of 379 sales over two years.
Sales completed to July 2026, as registered by 29 Aug 2026 · headline figures cover the 12 months to May 2026 (later months are still being registered) Harborne = the postcodes closer to Harborne's centre than to any neighbouring area centre within Birmingham
| Type | Sales | Median price | £/sq ft | Typical size | Change (1y) |
|---|---|---|---|---|---|
| Detached | 23 | £650,000 | £457 | 1,389 sq ft | n < 30 |
| Semi-detached | 38 | £525,500 | £410 | 1,238 sq ft | +12.1% |
| Terraced | 83 | £355,000 | £369 | 947 sq ft | +4.4% |
| Flats | 31 | £142,000 | £243 | 624 sq ft | +16.4% |
| Period | Median sold price | Sales |
|---|---|---|
| Q4 2021 | £381,250 | 38 |
| Q1 2022 | £347,875 | 63 |
| Q2 2022 | £360,000 | 61 |
| Q3 2022 | £397,500 | 80 |
| Q4 2022 | £399,950 | 65 |
| Q1 2023 | £303,250 | 42 |
| Q2 2023 | £287,500 | 36 |
| Q3 2023 | £365,000 | 53 |
| Q4 2023 | £370,000 | 47 |
| Q1 2024 | £390,000 | 55 |
| Q2 2024 | £342,000 | 45 |
| Q3 2024 | £315,000 | 59 |
| Q4 2024 | £327,500 | 58 |
| Q1 2025 | £347,000 | 63 |
| Q2 2025 | £311,250 | 32 |
| Q3 2025 | £348,950 | 53 |
| Q4 2025 | £430,000 | 49 |
| Q1 2026 | £385,000 | 35 |
| Q2 2026 | £348,500 | 26 |
| Q3 2026 | £776,200 | 4 |
Median of completed sales per period, not seasonally adjusted; the latest months are still being registered.
Most homes in Harborne sold for £190k–£415k (42% of sales).
| Sold | Address | Type | Price | Floor area | £/sq ft | vs last sale |
|---|---|---|---|---|---|---|
| 24 Jul 2026 | 79, Tennal Road B32 2JB | Semi-detached | £550,000 | 1,690 sq ft | £325 | +20% (2020) |
| 3 Jul 2026 | 46, Park Hill Road B17 9HJ | Semi-detached | £940,000 | 2,637 sq ft | £356 | — |
| 3 Jul 2026 | 7, Oakham Road B17 9DQ | Detached | £925,000 | 2,185 sq ft | £423 | — |
| 3 Jul 2026 | 5, Emerson Road B17 9LT | Semi-detached | £627,400 | 1,593 sq ft | £394 | +7% (2022) |
| 26 Jun 2026 | 86, Carless Avenue B17 9BW | Semi-detached | £965,000 | 1,916 sq ft | £504 | — |
| 26 Jun 2026 | Flat 3, Pinner Court, 313, High Street B17 9QL | Flats · Leasehold | £165,000 | 689 sq ft | £240 | — |
| 26 Jun 2026 | 17, Cedarhurst B32 2JZ | Flats · Leasehold | £127,500 | 818 sq ft | £156 | — |
| 22 Jun 2026 | 80, Fredas Grove B17 0SY | Terraced | £230,000 | 592 sq ft | £389 | — |
| 18 Jun 2026 | 153, Ferncliffe Road B17 0QJ | Terraced | £257,500 | 753 sq ft | £342 | +24% (2019) |
| 17 Jun 2026 | Flat 6, Yewdale, 196, Harborne Park Road B17 0BP | Flats · Leasehold | £220,000 | — | — | — |
| 15 Jun 2026 | 41, Lordswood Road B17 9QT | Semi-detached | £639,500 | 1,421 sq ft | £450 | +9% (2022) |
| 15 Jun 2026 | 4, Station Road B17 9JT | Semi-detached | £350,000 | 1,324 sq ft | £264 | — |
| 15 Jun 2026 | 11, Bantock Way B17 0LY | Terraced | £260,000 | 883 sq ft | £295 | — |
| 11 Jun 2026 | 9f, Lordswood Road B17 9RP | Flats · Leasehold | £158,000 | 366 sq ft | £432 | −4% (2020) |
| 5 Jun 2026 | 34, Rose Road B17 9LJ | Semi-detached | £410,000 | 1,173 sq ft | £349 | — |
| 29 May 2026 | 33, Earls Court Road B17 9AH | Terraced | £355,000 | 1,066 sq ft | £333 | — |
| 29 May 2026 | 38, Hartledon Road B17 0AD | Detached | £317,000 | 786 sq ft | £403 | +10% (2021) |
| 28 May 2026 | 6, Tudor Terrace B17 9SB | Terraced | £260,000 | 700 sq ft | £372 | — |
| 22 May 2026 | 46, Pereira Road B17 9JN | Detached | £625,000 | 1,087 sq ft | £575 | — |
| 22 May 2026 | 90, Victoria Road B17 0AE | Terraced | £347,000 | 829 sq ft | £419 | +6% (2022) |
| 22 May 2026 | 4, Margaret Grove B17 9JH | Terraced | £317,500 | 700 sq ft | £454 | — |
| 20 May 2026 | 44, Westfield Road B15 3QG | Detached | £2,445,000 | 3,552 sq ft | £688 | — |
| 18 May 2026 | 96, Ferncliffe Road B17 0QH | Terraced | £269,000 | 936 sq ft | £287 | — |
| 15 May 2026 | 7, Pereira Road B17 9JG | Terraced | £750,000 | 2,217 sq ft | £338 | — |
| 22 Apr 2026 | 129, Park Hill Road B17 9HH | Terraced | £405,000 | 1,098 sq ft | £369 | — |
The most recent registered sales. Full histories, including every sale since 1995, are on the street pages.
Medians over five years for streets with at least five sales; "most active" counts the last 12 months.
| District | Sales (12m) | Median | £/sq ft | Change (1y) |
|---|---|---|---|---|
| B17 | 158 | £382,500 | £367 | +12.5% |
| B32 | 14 | £236,000 | £309 | — |
Nothing for sale in Harborne on Homello right now — showing Birmingham.



Part of Birmingham· West Midlands
A 90 m² (970 sq ft) home in Harborne is worth roughly £288k–£406k at the area's typical £297–£419 per square foot — a range, not a valuation.
Check your addressThe median sold price in Harborne, Birmingham was £375,000 in the 12 months to May 2026 (175 sales registered so far); the mean was £440,715. We quote medians because a few very expensive or very cheap sales pull a mean around. The West Midlands median over the same period was £251,000. Portals and the ONS publish different figures because they use different boundaries, windows and adjustments.
Homes sold in Harborne, Birmingham over the two years to May 2026 with a recorded floor area achieved a median £362 per square foot (interquartile range £297–£419), from 369 sales matched to an Energy Performance Certificate floor area.
In the 12 months to May 2026, the median was 13.6% up on the previous 12 months and 6.4% up on five years earlier. These compare completed sales registered so far; the most recent months are still being registered, so the latest figures move as late registrations arrive.
Of streets with at least five sales in the last five years, St Marys Road (B17) has the highest median sold price at £1,312,500 across 6 sales.
Every sale is from HM Land Registry's Price Paid Data for England and Wales, which we re-import monthly. Sales completed to July 2026, as registered by 29 Aug 2026 · headline figures cover the 12 months to May 2026 (later months are still being registered). Floor areas come from Energy Performance Certificates matched by address.
One email a month with the sales newly registered here — no account needed, unsubscribe in one click.
Sources and method. Sales completed to July 2026, as registered by 29 Aug 2026 · headline figures cover the 12 months to May 2026 (later months are still being registered).Next HM Land Registry release ~28 Sept 2026. Medians unless stated; averages only where 30 or more sales. Category A sales only (standard price-paid transactions), houses and flats.
Contains HM Land Registry data © Crown copyright and database right 2021. This data is licensed under the Open Government Licence v3.0. Floor areas derived from Energy Performance Certificate data © Crown copyright, licensed under the Open Government Licence v3.0. Contains OS data © Crown copyright and database right 2026. Contains Royal Mail data © Royal Mail copyright and database right 2026. Source: Office for National Statistics licensed under the Open Government Licence v3.0.
How we calculate these figures · Ask us to hide a sale or correct a record