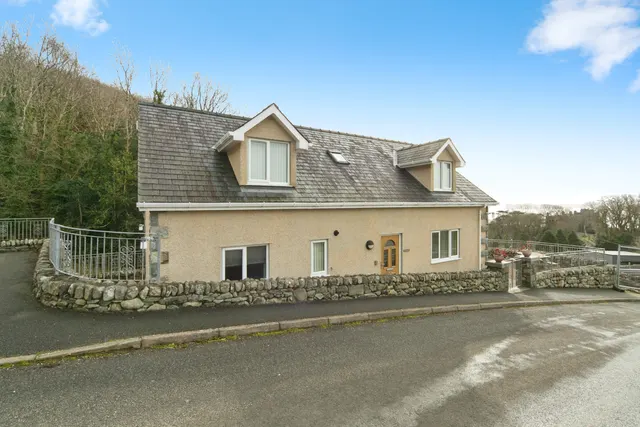
1/12
£140,000
Flat · 3 beds · 2 baths · approximately1,141 sq ft
Llys Dedwydd, Barmouth, LL42
Leasehold
Added two days ago 
Gwynedd · 9 sales registered so far in the 12 months to June 2026 · HM Land Registry data
Only 9 sales were registered in Talybont, Gwynedd in the 12 months to June 2026. That is too few for an average, so the sales themselves are listed below (median of 9 sales: £214,000).
Sales completed to August 2026, as registered by 4 Oct 2026 · headline figures cover the 12 months to June 2026 (later months are still being registered) Talybont = the Talybont post town: LL43 (as recorded in the sales)
| Type | Sales | Median price | £/sq ft | Typical size | Change (1y) |
|---|---|---|---|---|---|
| Detached | 38 | £285,000 | £340 | 786 sq ft | n/a |
| Period | Median sold price | Sales |
|---|---|---|
| 2017 | £169,500 | 10 |
| 2018 | £195,500 | 11 |
| 2019 | £154,625 | 6 |
| 2020 | £188,750 | 6 |
| 2021 | £250,750 | 8 |
| 2022 | £285,000 | 11 |
| 2023 | £280,000 | 10 |
| 2024 | £270,000 | 17 |
| 2025 | £237,500 | 9 |
| 2026 | £202,500 | 2 |
Median of completed sales per period, not seasonally adjusted; the latest months are still being registered.
| Sold | Address | Type | Price | Floor area | £/sq ft | vs last sale |
|---|---|---|---|---|---|---|
| 29 May 2026 | 67, Llwyn Ynn LL43 2AG | Terraced | £200,000 | 689 sq ft | £290 | +14% (2024) |
| 29 Apr 2026 | 32, Llwyn Ynn LL43 2AG | Detached | £205,000 | 667 sq ft | £307 | n/a |
| 3 Dec 2025 | Machlud Haul, 49, Llwyn Ynn LL43 2AL | Terraced | £214,000 | 657 sq ft | £326 | n/a |
| 20 Nov 2025 | 1, Llwyn Ynn LL43 2AG | Semi-detached | £200,000 | 689 sq ft | £290 | n/a |
| 17 Oct 2025 | 44, Llwyn Ynn LL43 2AG | Detached | £240,000 | 753 sq ft | £319 | n/a |
| 14 Oct 2025 | 29, Llwyn Ynn LL43 2AL | Semi-detached | £213,500 | 689 sq ft | £310 | n/a |
| 9 Oct 2025 | 61, Llwyn Ynn LL43 2AL | Detached | £237,500 | 786 sq ft | £302 | n/a |
| 15 Aug 2025 | 64, Llwyn Ynn LL43 2AL | Detached | £255,000 | 764 sq ft | £334 | n/a |
| 1 Jul 2025 | Swnywylan LL43 2AA | Terraced | £260,000 | n/a | n/a | n/a |
| 28 Apr 2025 | 6, Glan Ysgethin LL43 2BB | Detached | £347,000 | 1,281 sq ft | £271 | +45% (2019) |
| 21 Mar 2025 | 25, Llwyn Ynn LL43 2AL | Terraced | £135,000 | 753 sq ft | £179 | n/a |
| 20 Nov 2024 | Glyn Berwys LL43 2AA | Detached | £335,000 | n/a | n/a | n/a |
| 6 Nov 2024 | 67, Llwyn Ynn LL43 2AG | Terraced | £175,000 | 689 sq ft | £254 | n/a |
| 16 Oct 2024 | Tawelfan LL43 2AF | Detached | £355,000 | n/a | n/a | n/a |
| 16 Oct 2024 | 73, Llwyn Ynn LL43 2AG | Detached | £230,000 | 657 sq ft | £350 | n/a |
The most recent registered sales. Full histories, including every sale since 1995, are on the street pages.
Medians over five years for streets with at least five sales; "most active" counts the last 12 months.
| District | Sales (12m) | Median | Change (1y) |
|---|---|---|---|
| LL43 | 9 | n/a | n/a |
Part of Wales
Of streets with at least five sales in the last five years, Ffordd Glan Mor (LL43) has the highest median sold price at £330,000 across 5 sales.
Every sale is from HM Land Registry's Price Paid Data for England and Wales, which we re-import monthly. Sales completed to August 2026, as registered by 4 Oct 2026 · headline figures cover the 12 months to June 2026 (later months are still being registered). Floor areas come from Energy Performance Certificates matched by address.
One email a month with the sales newly registered here. No account needed, and you can unsubscribe in one click.
Sources and method. Sales completed to August 2026, as registered by 4 Oct 2026 · headline figures cover the 12 months to June 2026 (later months are still being registered).Next HM Land Registry release ~28 Oct 2026. Medians unless stated; averages only where 30 or more sales. Category A sales only (standard price-paid transactions), houses and flats.
Contains HM Land Registry data © Crown copyright and database right 2021. This data is licensed under the Open Government Licence v3.0. Floor areas derived from Energy Performance Certificate data © Crown copyright, licensed under the Open Government Licence v3.0. Contains OS data © Crown copyright and database right 2026. Contains Royal Mail data © Royal Mail copyright and database right 2026. Source: Office for National Statistics licensed under the Open Government Licence v3.0.
How we calculate these figures · Ask us to hide a sale or correct a record