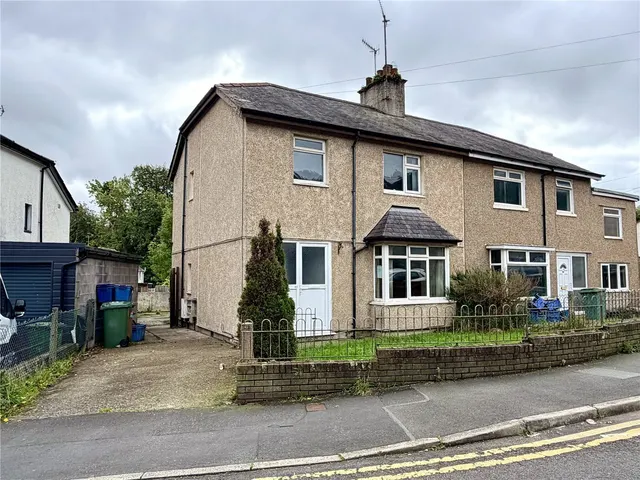
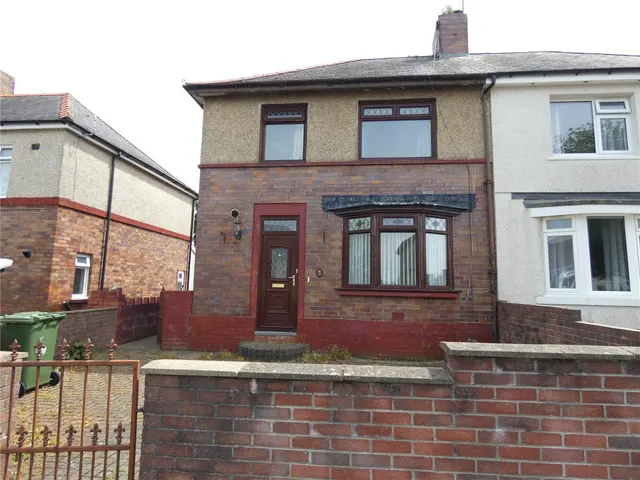
1/26
Retirement
£575,000
Bungalow · 3 beds · 2 baths · 1,956 sq ft
Cae Mair, Beaumaris
Freehold
Added on 02/10/2026 
Gwynedd · 228 sales registered so far in the 12 months to June 2026 · HM Land Registry data
The average (median) house price in Bangor, Gwynedd was £185,000 in the 12 months to June 2026, from 228 sales registered so far. That is 5.7% up on the year before and 15.6% up on five years ago. Terraced homes were the most common sale at a median £147,500; detached £337,500; semi-detached £225,000. Homes with a recorded floor area sold for about £197 per square foot (£2,120/m²), based on 409 of 476 sales over two years.
Sales completed to August 2026, as registered by 4 Oct 2026 · headline figures cover the 12 months to June 2026 (later months are still being registered) Bangor = the Bangor post town: LL57 (as recorded in the sales)
| Type | Sales | Median price | £/sq ft | Typical size | Change (1y) |
|---|---|---|---|---|---|
| Detached | 40 | £337,500 | £280 | 1,249 sq ft | −0.7% |
| Semi-detached | 66 | £225,000 | £235 | 963 sq ft | +7.1% |
| Terraced | 113 | £147,500 | £182 | 829 sq ft | +0.7% |
| Period | Median sold price | Sales |
|---|---|---|
| Q4 2021 | £158,500 | 111 |
| Q1 2022 | £165,000 | 75 |
| Q2 2022 | £161,500 | 76 |
| Q3 2022 | £154,000 | 78 |
| Q4 2022 | £175,500 | 94 |
| Q1 2023 | £157,000 | 65 |
| Q2 2023 | £155,000 | 58 |
| Q3 2023 | £180,000 | 69 |
| Q4 2023 | £180,000 | 70 |
| Q1 2024 | £175,000 | 45 |
| Q2 2024 | £190,000 | 61 |
| Q3 2024 | £182,500 | 72 |
| Q4 2024 | £175,000 | 61 |
| Q1 2025 | £162,500 | 66 |
| Q2 2025 | £205,000 | 49 |
| Q3 2025 | £175,000 | 77 |
| Q4 2025 | £187,500 | 66 |
| Q1 2026 | £225,000 | 51 |
| Q2 2026 | £169,750 | 34 |
| Q3 2026 | £187,500 | 23 |
Median of completed sales per period, not seasonally adjusted; the latest months are still being registered.
Most homes in Bangor sold for £85k–£235k (70% of sales).
| Sold | Address | Type | Price | Floor area | £/sq ft | vs last sale |
|---|---|---|---|---|---|---|
| 19 Aug 2026 | 48, Ffordd Y Castell LL57 1SU | Terraced | £130,000 | 1,044 sq ft | £125 | +8% (2023) |
| 14 Aug 2026 | 7, Cae'R Deon LL57 4LS | Semi-detached | £208,000 | 958 sq ft | £217 | +9% (2023) |
| 14 Aug 2026 | 6, Bryn Eglwys LL57 4BQ | Terraced | £153,000 | 818 sq ft | £187 | −3% (2021) |
| 10 Aug 2026 | 8, Hafod Lon LL57 4GD | Detached | £187,500 | 635 sq ft | £295 | n/a |
| 7 Aug 2026 | 14, Ffordd Coed Mawr LL57 4TB | Semi-detached | £166,000 | 980 sq ft | £169 | n/a |
| 7 Aug 2026 | 68, Ambrose Street LL57 1DF | Terraced | £137,000 | 840 sq ft | £163 | +14% (2022) |
| 5 Aug 2026 | Flat 9, Saer Lys, Mount Street LL57 1BF | Flats · Leasehold | £72,000 | n/a | n/a | n/a |
| 31 Jul 2026 | 10, Penlon Gardens LL57 1AQ | Semi-detached | £213,500 | 1,055 sq ft | £202 | +2% (2024) |
| 31 Jul 2026 | 10, Neuadd Yr Eglwys LL57 1BJ | Flats · Leasehold | £78,500 | 560 sq ft | £140 | n/a |
| 30 Jul 2026 | 40, Ffordd Cynan LL57 2NS | Terraced | £220,000 | 840 sq ft | £262 | +59% (2020) |
| 17 Jul 2026 | Water View, Cwrt Hwfa LL57 2BE | Detached | £472,500 | n/a | n/a | n/a |
| 17 Jul 2026 | 49, Ffordd Crwys LL57 2NT | Semi-detached | £295,000 | 947 sq ft | £311 | n/a |
| 13 Jul 2026 | Flat 2, Uxbridge Court, Holyhead Road LL57 2HW | Flats · Leasehold | £75,000 | 592 sq ft | £127 | −7% (2023) |
| 10 Jul 2026 | Llys-Y-Bryn, Dob LL57 4PW | Detached | £576,000 | n/a | n/a | n/a |
| 10 Jul 2026 | 2, Lon Eryri LL57 2QF | Detached | £450,000 | 1,507 sq ft | £299 | n/a |
| 10 Jul 2026 | 30, Trefonwys LL57 2HU | Detached | £385,000 | 2,530 sq ft | £152 | n/a |
| 10 Jul 2026 | 9, Erw Las LL57 3NN | Detached | £350,000 | n/a | n/a | n/a |
| 10 Jul 2026 | 5, Bro Infryn LL57 4UR | Terraced | £233,000 | 1,270 sq ft | £183 | n/a |
| 10 Jul 2026 | 62, Ffordd Cynan LL57 2NS | Detached | £120,000 | n/a | n/a | n/a |
| 7 Jul 2026 | 12, Caeau Gleision LL57 4EW | Detached | £225,000 | 829 sq ft | £271 | n/a |
| 3 Jul 2026 | 10, Min Y Ddol LL57 1ND | Semi-detached | £145,000 | 893 sq ft | £162 | n/a |
| 3 Jul 2026 | 10, Strand Street LL57 1DH | Terraced | £127,000 | 667 sq ft | £190 | n/a |
| 1 Jul 2026 | 19, Gerlan Road LL57 3TL | Terraced | £143,750 | 926 sq ft | £155 | n/a |
| 30 Jun 2026 | 10, Tan Y Graig LL57 4SD | Terraced | £101,000 | 689 sq ft | £147 | n/a |
| 24 Jun 2026 | 33, Rhosfryn LL57 2DL | Semi-detached | £170,000 | 732 sq ft | £232 | n/a |
The most recent registered sales. Full histories, including every sale since 1995, are on the street pages.
Medians over five years for streets with at least five sales; "most active" counts the last 12 months.
| District | Sales (12m) | Median | £/sq ft | Change (1y) |
|---|---|---|---|---|
| LL57 | 228 | £185,000 | £197 | +5.7% |
Homes for sale in Bangor today ask a median £190,000 (n = 37) vs £185,000 sold, so asking is 3% above recent sold prices; £203 vs £197 per sq ft. 39% of Homello's listings here are under offer. Asking ≠ achieved; sold prices reflect deals agreed 4–6 months ago.





Part of Wales
A 90 m² (970 sq ft) home in Bangor is worth roughly £156k–£235k at the area's typical £161–£243 per square foot. That is a range, not a valuation.
Check your addressThe median sold price in Bangor, Gwynedd was £185,000 in the 12 months to June 2026 (228 sales registered so far); the mean was £208,158. We quote medians because a few very expensive or very cheap sales pull a mean around. The Wales median over the same period was £220,000. Portals and the ONS publish different figures because they use different boundaries, windows and adjustments.
Homes sold in Bangor, Gwynedd over the two years to June 2026 with a recorded floor area achieved a median £197 per square foot (interquartile range £161–£243), from 409 sales matched to an Energy Performance Certificate floor area.
In the 12 months to June 2026, the median was 5.7% up on the previous 12 months and 15.6% up on five years earlier. These compare completed sales registered so far; the most recent months are still being registered, so the latest figures move as late registrations arrive.
Of streets with at least five sales in the last five years, Lon Y Bryn (LL57) has the highest median sold price at £397,500 across 6 sales.
Every sale is from HM Land Registry's Price Paid Data for England and Wales, which we re-import monthly. Sales completed to August 2026, as registered by 4 Oct 2026 · headline figures cover the 12 months to June 2026 (later months are still being registered). Floor areas come from Energy Performance Certificates matched by address.
One email a month with the sales newly registered here. No account needed, and you can unsubscribe in one click.
Sources and method. Sales completed to August 2026, as registered by 4 Oct 2026 · headline figures cover the 12 months to June 2026 (later months are still being registered).Next HM Land Registry release ~28 Oct 2026. Medians unless stated; averages only where 30 or more sales. Category A sales only (standard price-paid transactions), houses and flats.
Contains HM Land Registry data © Crown copyright and database right 2021. This data is licensed under the Open Government Licence v3.0. Floor areas derived from Energy Performance Certificate data © Crown copyright, licensed under the Open Government Licence v3.0. Contains OS data © Crown copyright and database right 2026. Contains Royal Mail data © Royal Mail copyright and database right 2026. Source: Office for National Statistics licensed under the Open Government Licence v3.0.
How we calculate these figures · Ask us to hide a sale or correct a record