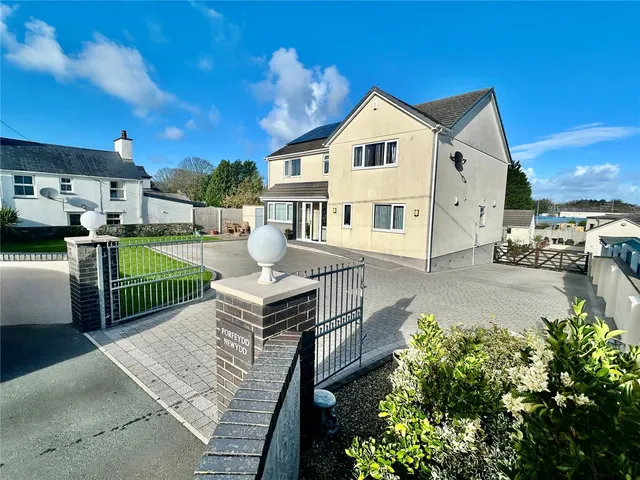
1/25
£495,000
Detached · 4 beds · 3 baths · 3,159 sq ft
Ffordd Tan Y Bryn, Amlwch, LL68
Freehold
Reduced on 02/10/2026 
Isle of Anglesey · 17 sales registered so far in the 12 months to June 2026 · HM Land Registry data
The median house price in Cemaes Bay, Isle of Anglesey was £240,000 in the 12 months to June 2026, from 17 sales registered so far, which is too few to measure change reliably. Over five years the median is £230,000 from 99 sales.
Sales completed to August 2026, as registered by 4 Oct 2026 · headline figures cover the 12 months to June 2026 (later months are still being registered) Cemaes Bay = the Cemaes Bay post town: LL67 (as recorded in the sales)
| Type | Sales | Median price | £/sq ft | Typical size | Change (1y) |
|---|---|---|---|---|---|
| Detached | 55 | £284,500 | £272 | 1,066 sq ft | n/a |
| Semi-detached | 16 | £184,750 | £216 | 893 sq ft | n < 30 |
| Terraced | 24 | £161,250 | £190 | 840 sq ft | n < 30 |
| Period | Median sold price | Sales |
|---|---|---|
| 2017 | £174,995 | 21 |
| 2018 | £180,000 | 33 |
| 2019 | £188,000 | 13 |
| 2020 | £196,408 | 26 |
| 2021 | £230,000 | 39 |
| 2022 | £240,000 | 24 |
| 2023 | £237,500 | 14 |
| 2024 | £222,950 | 18 |
| 2025 | £233,475 | 20 |
| 2026 | £209,750 | 8 |
Median of completed sales per period, not seasonally adjusted; the latest months are still being registered.
| Sold | Address | Type | Price | Floor area | £/sq ft | vs last sale |
|---|---|---|---|---|---|---|
| 21 Aug 2026 | 47, Gwelfor Estate LL67 0NL | Detached | £235,000 | 872 sq ft | £270 | n/a |
| 22 Jul 2026 | 16, Gwelfor Estate LL67 0NL | Detached | £400,000 | 1,916 sq ft | £209 | n/a |
| 3 Jul 2026 | Ty Lawr, Beach Road LL67 0ES | Detached | £650,000 | n/a | n/a | n/a |
| 16 Apr 2026 | 5, Victoria Road LL67 0HR | Terraced | £160,000 | 872 sq ft | £184 | −7% (2024) |
| 18 Mar 2026 | Flat 6, Harbour View LL67 0NG | Flats · Leasehold | £145,000 | 570 sq ft | £254 | n/a |
| 24 Feb 2026 | 9, Tyddyn Bach LL67 0LJ | Detached | £290,000 | 1,087 sq ft | £267 | n/a |
| 4 Feb 2026 | 16, Maes Padrig LL67 0EY | Semi-detached | £184,500 | 893 sq ft | £207 | +48% (2020) |
| 21 Jan 2026 | 73, High Street LL67 0HL | Terraced | £115,000 | 710 sq ft | £162 | n/a |
| 3 Dec 2025 | 15, Maes Garnedd LL67 0DR | Terraced | £125,000 | 807 sq ft | £155 | +19% (2021) |
| 28 Nov 2025 | Gongl Felys LL67 0DS | Detached | £355,000 | n/a | n/a | n/a |
| 28 Nov 2025 | 3, Cae Garnedd Estate LL67 0ED | Semi-detached | £243,000 | 850 sq ft | £286 | n/a |
| 19 Nov 2025 | 17, Cae Derwydd LL67 0LP | Detached | £395,000 | 1,464 sq ft | £270 | n/a |
| 23 Oct 2025 | 4, Tyddyn Bach LL67 0LJ | Semi-detached | £240,000 | 915 sq ft | £262 | n/a |
| 9 Oct 2025 | Penrhyn House, 1, Bol Don LL67 0HJ | Detached | £350,000 | 1,227 sq ft | £285 | n/a |
| 25 Sept 2025 | 14, Stad Castellor LL67 0NP | Detached | £260,000 | 883 sq ft | £295 | n/a |
The most recent registered sales. Full histories, including every sale since 1995, are on the street pages.
Medians over five years for streets with at least five sales; "most active" counts the last 12 months.
| District | Sales (12m) | Median | £/sq ft | Change (1y) |
|---|---|---|---|---|
| LL67 | 17 | £240,000 | £213 | n/a |


Part of Wales
A 90 m² (970 sq ft) home in Cemaes Bay is worth roughly £178k–£261k at the area's typical £184–£269 per square foot. That is a range, not a valuation.
Check your addressThe median sold price in Cemaes Bay, Isle of Anglesey was £240,000 in the 12 months to June 2026 (17 sales registered so far); the mean was £235,556. We quote medians because a few very expensive or very cheap sales pull a mean around. The Wales median over the same period was £220,000. Portals and the ONS publish different figures because they use different boundaries, windows and adjustments.
Homes sold in Cemaes Bay, Isle of Anglesey over the two years to June 2026 with a recorded floor area achieved a median £213 per square foot (interquartile range £184–£269), from 30 sales matched to an Energy Performance Certificate floor area.
Of streets with at least five sales in the last five years, Gwelfor Estate (LL67) has the highest median sold price at £287,225 across 8 sales.
Every sale is from HM Land Registry's Price Paid Data for England and Wales, which we re-import monthly. Sales completed to August 2026, as registered by 4 Oct 2026 · headline figures cover the 12 months to June 2026 (later months are still being registered). Floor areas come from Energy Performance Certificates matched by address.
One email a month with the sales newly registered here. No account needed, and you can unsubscribe in one click.
Sources and method. Sales completed to August 2026, as registered by 4 Oct 2026 · headline figures cover the 12 months to June 2026 (later months are still being registered).Next HM Land Registry release ~28 Oct 2026. Medians unless stated; averages only where 30 or more sales. Category A sales only (standard price-paid transactions), houses and flats.
Contains HM Land Registry data © Crown copyright and database right 2021. This data is licensed under the Open Government Licence v3.0. Floor areas derived from Energy Performance Certificate data © Crown copyright, licensed under the Open Government Licence v3.0. Contains OS data © Crown copyright and database right 2026. Contains Royal Mail data © Royal Mail copyright and database right 2026. Source: Office for National Statistics licensed under the Open Government Licence v3.0.
How we calculate these figures · Ask us to hide a sale or correct a record

