1/8
£900,000
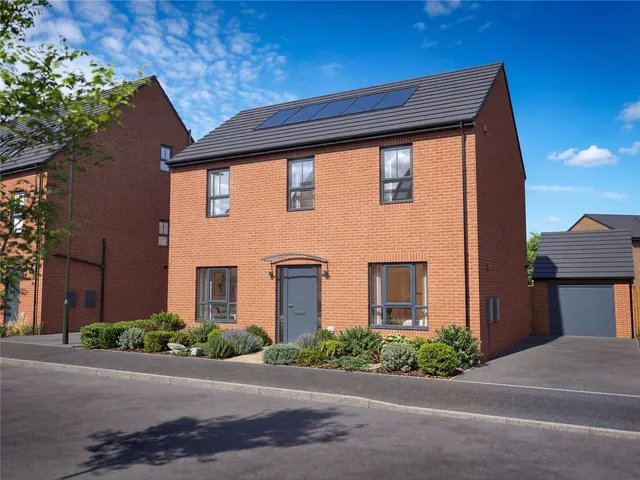
2 beds · 1 bath · 499 sq ft
Carnaby Covert Lane, Carnaby, Bridlington, East Yorkshire, YO15 3QA
Freehold
Added on 31/08/2026 
Yorkshire and the Humber · 7,924 sales registered so far in the 12 months to May 2026 · HM Land Registry data
The average (median) house price in East Riding of Yorkshire, Yorkshire and the Humber was £190,000 in the 12 months to May 2026, from 7,924 sales registered so far — 2.1% down on the year before and 8.6% up on five years ago. Semi-detached homes were the most common sale at a median £190,000; detached £320,000; terraced £140,000; flats £95,250. Homes with a recorded floor area sold for about £213 per square foot (£2,293/m²), based on 16,379 of 17,378 sales over two years.
Sales completed to July 2026, as registered by 29 Aug 2026 · headline figures cover the 12 months to May 2026 (later months are still being registered) East Riding of Yorkshire = the ceremonial county (East Riding of Yorkshire, City of Kingston Upon Hull in HM Land Registry's records)
| vs parent | |||||
|---|---|---|---|---|---|
| Hull East Riding of Yorkshire | £153,000 | £182 | −1.3% | 3,479 | 81% |
| Beverley East Riding of Yorkshire | £260,000 | £265 | −1.9% | 703 | 137% |
| Goole East Riding of Yorkshire | £215,000 | £221 | −2.3% | 692 | 113% |
| Bridlington East Riding of Yorkshire | £182,000 | £213 | −1.6% | 638 | 96% |
| Driffield East Riding of Yorkshire | £220,000 | £234 | +4.3% | 554 | 116% |
| Brough East Riding of Yorkshire | £238,000 | £246 | −6.7% | 397 | 125% |
| Cottingham East Riding of Yorkshire | £250,000 | £240 | +2.0% | 270 | 132% |
| Hessle East Riding of Yorkshire | £210,000 | £220 | +2.4% | 265 | 111% |
| Hornsea East Riding of Yorkshire | £212,875 | £235 | −5.4% | 168 | 112% |
| North Ferriby East Riding of Yorkshire | £315,000 | £260 | −1.6% | 125 | 166% |
| Withernsea East Riding of Yorkshire | £140,000 | £155 | −8.2% | 119 | 74% |
| Type | Sales | Median price | £/sq ft | Typical size | Change (1y) |
|---|---|---|---|---|---|
| Detached | 2,161 | £320,000 | £262 | 1,216 sq ft | +0.6% |
| Semi-detached | 2,819 | £190,000 | £221 | 893 sq ft | −2.6% |
| Terraced | 2,532 | £140,000 | £165 | 850 sq ft | +1.3% |
| Flats | 412 | £95,250 | £164 | 581 sq ft | −9.3% |
| Period | Median sold price | Sales |
|---|---|---|
| Q4 2021 | £172,500 | 2615 |
| Q1 2022 | £175,000 | 2399 |
| Q2 2022 | £178,000 | 2576 |
| Q3 2022 | £185,000 | 2903 |
| Q4 2022 | £192,500 | 2752 |
| Q1 2023 | £183,400 | 1935 |
| Q2 2023 | £190,000 | 2061 |
| Q3 2023 | £192,500 | 2264 |
| Q4 2023 | £185,000 | 2144 |
| Q1 2024 | £180,000 | 1779 |
| Q2 2024 | £197,000 | 2085 |
| Q3 2024 | £188,500 | 2427 |
| Q4 2024 | £190,500 | 2522 |
| Q1 2025 | £200,000 | 2579 |
| Q2 2025 | £192,000 | 2029 |
| Q3 2025 | £191,000 | 2473 |
| Q4 2025 | £185,000 | 2148 |
| Q1 2026 | £185,000 | 1529 |
| Q2 2026 | £185,000 | 1375 |
| Q3 2026 | £187,500 | 272 |
Median of completed sales per period, not seasonally adjusted; the latest months are still being registered.
UK House Price Index (mix-adjusted) for East Riding of Yorkshire: £220,721, +3.7% on the year (June 2026) — why this differs from our median.
Most homes in East Riding of Yorkshire sold for £80k–£230k (63% of sales).
| Sold | Address | Type | Price | Floor area | £/sq ft | vs last sale |
|---|---|---|---|---|---|---|
| 31 Jul 2026 | 11, Wickwane Road HU17 9PB | Terraced | £160,000 | 721 sq ft | £222 | +12% (2021) |
| 30 Jul 2026 | 67, Wellesley Avenue HU6 7LN | Terraced | £200,000 | 1,313 sq ft | £152 | +18% (2021) |
| 29 Jul 2026 | 30, Battersea Park HU8 0AP | Terraced | £218,000 | 1,055 sq ft | £207 | +6% (2022) |
| 29 Jul 2026 | 12, Silver Birch Close HU17 0ZN | Terraced | £180,000 | 710 sq ft | £253 | +3% (2024) |
| 28 Jul 2026 | Honeysuckle Cottage, 2, Beech Drive HU14 3HQ | Detached | £390,000 | 1,550 sq ft | £252 | — |
| 28 Jul 2026 | 17, Council Houses YO25 9UU | Semi-detached | £320,000 | 1,302 sq ft | £246 | — |
| 28 Jul 2026 | 38, Beechdale HU16 4RH | Semi-detached | £240,000 | 1,055 sq ft | £228 | +19% (2023) |
| 28 Jul 2026 | Apartment 14 Oldroyd House, the Old School, Reynoldson Street HU5 3FB | Flats · Leasehold | £120,000 | 786 sq ft | £153 | −8% (2022) |
| 27 Jul 2026 | Woodview, Station Road DN14 8NQ | Detached | £375,000 | — | — | — |
| 27 Jul 2026 | 2, Halifax Close YO42 2XF | Detached | £347,500 | 936 sq ft | £371 | +14% (2021) |
| 27 Jul 2026 | 35, Nunburnholme Park HU5 5YN | Semi-detached | £225,000 | 614 sq ft | £367 | +76% (2021) |
| 27 Jul 2026 | 40, Ridgestone Avenue HU11 4AH | Semi-detached | £195,000 | 829 sq ft | £235 | +11% (2022) |
| 27 Jul 2026 | 113, Waudby Way HU9 4DG | Semi-detached | £174,250 | 829 sq ft | £210 | +6% (2022) |
| 27 Jul 2026 | 75, Saffrondale HU10 6QA | Terraced | £150,000 | 969 sq ft | £155 | +22% (2019) |
| 26 Jul 2026 | 25, Hemble Way HU7 3ET | Semi-detached | £151,500 | 527 sq ft | £287 | +4% (2025) |
| 24 Jul 2026 | 2, Dyon Drive YO8 6LJ | Detached | £565,000 | 2,120 sq ft | £266 | — |
| 24 Jul 2026 | 4, Hyde Park Road HU7 3AW | Detached | £280,000 | 1,345 sq ft | £208 | +10% (2021) |
| 24 Jul 2026 | 7, Roseacres DN14 5PP | Detached | £275,000 | 1,001 sq ft | £275 | +28% (2019) |
| 24 Jul 2026 | 6, Crumpton Road YO43 3RQ | Detached | £245,000 | 807 sq ft | £303 | — |
| 24 Jul 2026 | 59, Punton Walk DN14 9TB | Detached | £245,000 | 560 sq ft | £438 | — |
| 24 Jul 2026 | 16, Long Lane HU17 0NH | Terraced | £237,500 | 753 sq ft | £315 | +13% (2019) |
| 24 Jul 2026 | 357, Ings Road HU7 4UY | Semi-detached | £227,500 | 1,195 sq ft | £190 | — |
| 24 Jul 2026 | 17, Glenfield Avenue YO43 3HH | Semi-detached | £220,000 | 743 sq ft | £296 | +38% (2020) |
| 24 Jul 2026 | 9, Diversity Drive HU7 3LG | Semi-detached | £220,000 | 936 sq ft | £235 | +4% (2023) |
| 24 Jul 2026 | 17, Buttfield Road DN14 7DY | Semi-detached | £220,000 | 732 sq ft | £301 | — |
Medians over five years for streets with at least five sales; "most active" counts the last 12 months.



New-build sales register 6–12 months after completion; "resale" means a later sale at an address whose first recorded sale was a new build.
Part of Yorkshire and the Humber
A 90 m² (970 sq ft) home in East Riding of Yorkshire is worth roughly £159k–£253k at the area's typical £164–£261 per square foot — a range, not a valuation.
Check your addressThe median sold price in East Riding of Yorkshire, Yorkshire and the Humber was £190,000 in the 12 months to May 2026 (7,924 sales registered so far); the mean was £220,987. We quote medians because a few very expensive or very cheap sales pull a mean around. The Yorkshire and the Humber median over the same period was £210,500. Portals and the ONS publish different figures because they use different boundaries, windows and adjustments.
Homes sold in East Riding of Yorkshire, Yorkshire and the Humber over the two years to May 2026 with a recorded floor area achieved a median £213 per square foot (interquartile range £164–£261), from 16,379 sales matched to an Energy Performance Certificate floor area.
In the 12 months to May 2026, the median was 2.1% down on the previous 12 months and 8.6% up on five years earlier. These compare completed sales registered so far; the most recent months are still being registered, so the latest figures move as late registrations arrive.
Of streets with at least five sales in the last five years, Cave Road (HU15) has the highest median sold price at £1,269,000 across 5 sales.
Every sale is from HM Land Registry's Price Paid Data for England and Wales, which we re-import monthly. Sales completed to July 2026, as registered by 29 Aug 2026 · headline figures cover the 12 months to May 2026 (later months are still being registered). Floor areas come from Energy Performance Certificates matched by address.
One email a month with the sales newly registered here — no account needed, unsubscribe in one click.
Sources and method. Sales completed to July 2026, as registered by 29 Aug 2026 · headline figures cover the 12 months to May 2026 (later months are still being registered).Next HM Land Registry release ~28 Sept 2026. Medians unless stated; averages only where 30 or more sales. Category A sales only (standard price-paid transactions), houses and flats.
Contains HM Land Registry data © Crown copyright and database right 2021. This data is licensed under the Open Government Licence v3.0. Floor areas derived from Energy Performance Certificate data © Crown copyright, licensed under the Open Government Licence v3.0. Contains OS data © Crown copyright and database right 2026. Contains Royal Mail data © Royal Mail copyright and database right 2026. Source: Office for National Statistics licensed under the Open Government Licence v3.0.
How we calculate these figures · Ask us to hide a sale or correct a record